Higher Temperature
Applications

In environments where escape from fire becomes difficult, and when fire can be produced by the burning of hydrocarbon fuels, the standards for acceptable fire behavior of materials become ever more stringent.
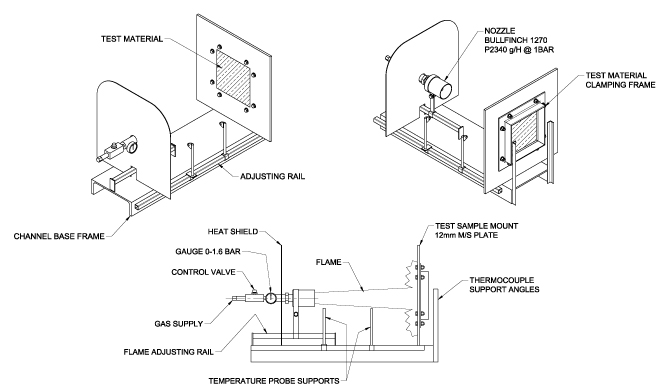
Regina developed a test rig for comparing burn behavior of different formulations, based on work done by Prof. Geoff Gibson, Professor of Composite Materials Engineering at the University of Newcastle upon Tyne.


(a.) protected fibreglass

(b.) unprotected fibreglass
Comparing a composite surface after testing in our test rig for 60 minutes at a surface temperature of 1100°C, with a similar composite surface including FireShield® illustrates the retention of surface structural integrity provided by the FireShield®.
A designer must consider initial cost, weight and strength, especially in air, sea and land vehicles, where extra weight increases operating cost over the life of the vehicle, and can add to the cost of the infrastructures required.
The use of FireShield® as part of a composite surface layer for multi-material panels, both structural and non-structural, can provide two critical properties under these conditions:
• Structural integrity of the surface underneath
• Self Extinguishing
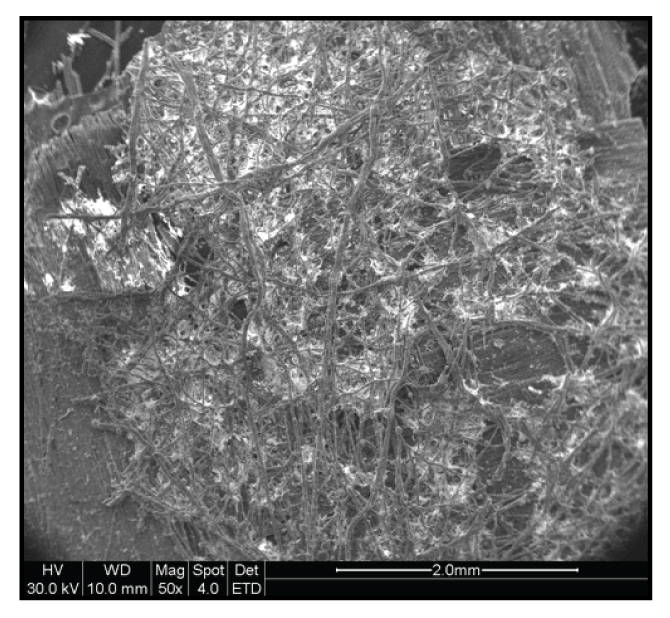
A SEM scan of the protected surface after the burn, conducted by the Royal Melbourne Institute of Technology (RMIT) showed a fine network of ceramic fibres, holding the surface together.
An Introduction to Fire Test Curves
“The following material is extracted from work undertaken as part of the Composites Fire Performance project of Cooperative Research Centre for Advanced Composite Structures Ltd (CRC-ACS), established and supported under the Australian Government's Cooperative Research Centres Program.”
Fire resistance is one of the key performance indices of a Passive Fire Protection (PFP) configuration.
It is determined by a furnace test in which a test specimen is exposed to the controlled temperature and pressure conditions of the furnace. Fire resistance is measured by the elapsed time for which the test specimen meets relevant performance criteria. For a non-load bearing PFP application, these criteria include fire integrity which requires that the test specimen maintains its separating function, and insulation performance which specifies the average temperature increase allowed on the unexposed surface of the specimen.
For PFP applications and construction elements, this allowable temperature increase is often specified as 140°C in relevant fire standards [6-7]. Assuming that a test specimen is originally at 20°C, the highest temperature on the unexposed surface of the specimen needs to be below 160°C to meet the insulation performance requirement.
A number of standards have been developed for fire resistance tests. In each of the test standards, one of the key test parameters defined is the controlled time-temperature curve (fire curve) of the furnace. Figure 6 compares three of the most commonly used fire curves defined in ISO 834, EN 1363-2 and UL 1709 standards respectively.
The ISO 834 curve is generally considered to be representative of a cellulosic fire and has been adapted in many other standards, including AS 1530.4 [9] and EN 1363-1 [10]. It is also frequently quoted in ISO 13702 (PTS 80.80.00.11) [1] for various PFP applications on Oil, Gas and Petrochemical (OG&P) installations.
The fire curve is defined by the following equation:
T = 350log10 (8t + 1) + 20
where, T is the average furnace temperature in °C and t is time in minutes respectively.

Figure 6: Comparison of standard furnace fire curves.
As shown in Figure 6, temperatures defined in both the EN 1363-2 and UL 1709 curves increase at much faster rates, reaching approximately 1100°C within 30 minutes in EN 1363-2 and 5 minutes in UL 1709 respectively. Temperatures are then held constant for the rest of the test time. Both curves are specified to simulate hydrocarbon pool fires. The EN 1363-2 fire curve can be mathematically described by:
T =1080(1- 0.325e-0.167t - 0.675e-0.25t)+ 20
No mathematical equation has been given to the UL 1709 fire cure, which is specified directly by discrete data points.
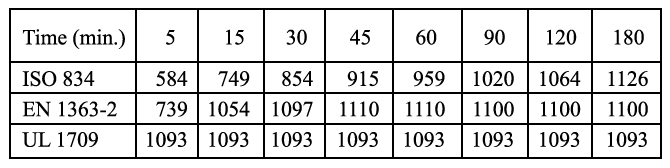
Table 5: Furnace temperatures at different times (°C)
Table 5 lists temperatures given at different times by the three fire curves. It shows that temperatures defined by ISO 834 exceed those defined by the other two standards after approximately three hours
of heating.
It should be noted that the fire curve is generally not the only key test parameter specified for a furnace test. For example, the furnace pressure needs to be controlled in an ISO 834 test whilst a heat flux is also specified in UL 1709.

Resin
When exposed to the high temperature fire studied in the present work, the vinyl ester resin burnt quickly leaving behind the bare fibre cloth. As shown in Figure 13a, within approximately the first five minutes of a fire test, the resin combusted to produce a strong yellow flame and a significant amount of smoke.
Depending on the thickness of the front face laminate, this burning period could last up to about fifteen minutes, after which the resin was consumed and the flame disappeared, see Figure 13b.
Figure 13: Burning of resin at early stage of a fire test
(13a) After 5 mins
(13b) After 15 mins
Visual inspections were conducted on the exposed surfaces of the protected and unprotected samples after fire tests. As shown in Figure 21, the Fireshield® veil burnt into a thin and white layer which, in the case of fibreglass glass face laminate, appeared to have protected the fibreglass reinforcement behind it from melting.

(a.) protected fibreglass
(b.) unprotected fibreglass

(c.) protected basalt

(d.) unprotected basalt
Figure 21: Exposed surface of composite laminates after fire tests
References
6. ISO 834-1-1999, Fire Resistance Tests - Element of Building Construction, Part 1: General Requirements.
7. EN 1363-2-1999, Fire Resistance Tests - Part 2: Alternative and Additional Procedures